After the first part we now have a couple of scripts able to extract some metrics from Docker containers. The next part will be to configure Zabbix to make use of those scripts to gather data and make awesome graphs.
Zabbix Infrastructure
Zabbix Server
Since I’m using Zabbix in the containerized environment, I’ll be running the Zabbix server in a Docker container (or several one actually). There are already some ready to use Zabbix server images available, one of the simplest being berngp/docker-zabbix by Bernardo Gomez Palacio. It comes with all Zabbix services (server, web server, mysql database and java gateway) packaged in a single image. While this is a nice way to discover Zabbix I won’t use this in a production(ish) environment as it does not use a data image to make sure you won’t lose your data during an upgrade and having all those services in a single image implies a great loss of flexibility.
I rather used Dennis Kanbier images which make a clean separation between data and the Zabbix services.
Zabbix Agent
In order to run the scripts I installed an agent on the host using Zabbix’s repository in order to have version consistency between the agent and server.
So now if everything is working fine you can connect to the Zabbix web server and add the host server in Zabbix, wait a couple of minutes and see the metrics flowing in.
Agent Configuration
In order to collect data from the scripts you need to configure some user parameters in the agent. In my case I added the following lines to the /etc/zabbix/zabbix_agentd.conf file:
UserParameter=docker.container.count[*],/usr/local/bin/containerCount.sh $1
UserParameter=docker.container.helper[*],/usr/local/bin/containerHelper.py $1 $2 $3
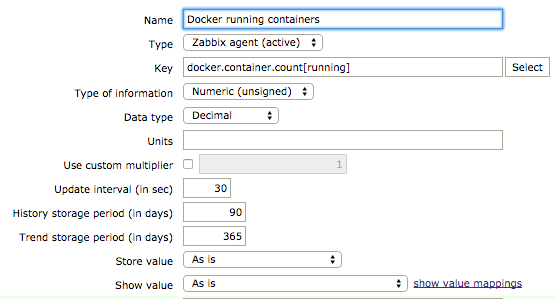
After restarting the agent you will be able to declare new items using one of the two scripts. For instance the number of running containers:

Then again if everything is allright, data should start flowing into Zabbix and you can start to create nice graphs.
Getting Data from Containers
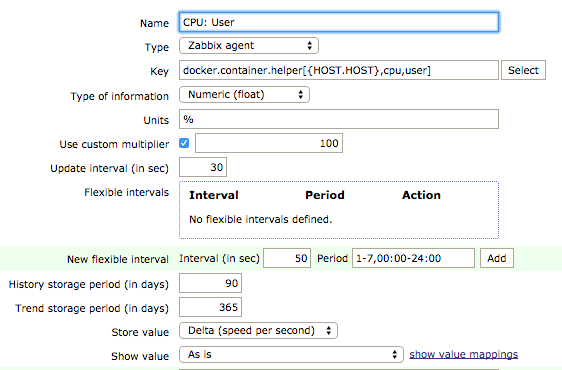
Adding the metrics from the containerHelper script will be done in the same way except that I’m going to create a template and declare all the metrics into it. For instance:

A bunch of things are worth noticing:
- The Key field is using a macro
{HOST.HOST}that will be replaced by the Id of the host using the template - The Type of information has been changed to Numeric (float) since the script returning a number of seconds with a fractional part
- The Store value field has be changed to Delta (speed per second) in order to have Zabbix computing the actual CPU consumption during a time period
- The Units and Use custom multiplier had been changed to display something nice : 1 second CPU consumtion in a 1 second would mean a CPU usage of 100% that is one fully occupied core
- The Type field is set to Zabbix agent not to Zabbix agent (active) as the server should be querying the agent and not the opposite
Creating Hosts
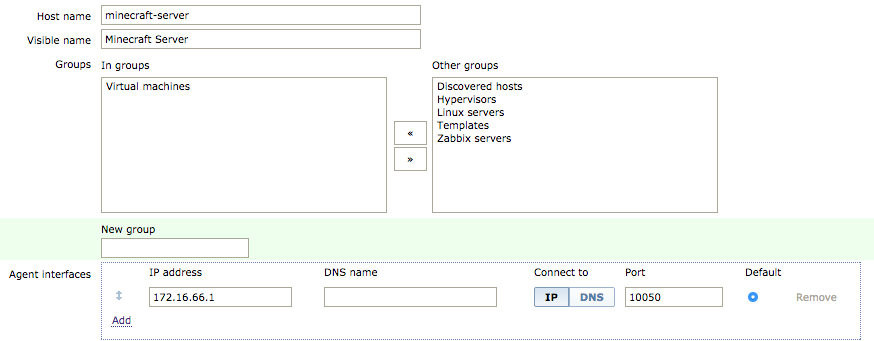
The last part will be to create a host for every container we want to monitor:

Then again the important points are:
- the Host name should be exactly the name of the docker container we want to monitor (you can put whatever you want in the Visible name)
- The IP address of the Agent interfaces should be the address of the Docker host (most likely the
.1address of Docker’s bridge interface) - You need to add the previously created template in Templates tab
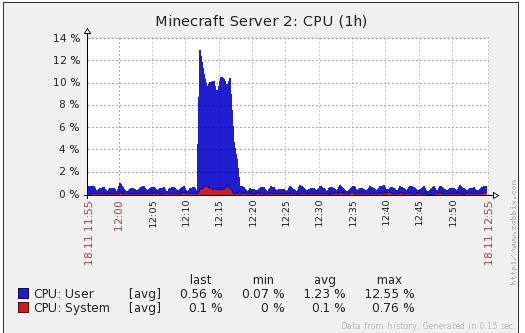
At this point Zabbix will start collecting data and after a while you’ll be able to enjoy some nice graphs:

Conclusion
Integration of the monitoring scripts into Zabbix was done with few simple configuration steps. Although I would love to have been able to discover automatically the Docker containers the result is quite good in my opinion:
- adding a containers requires only minimal configuration
- the mechanism is flexible and can be extended easily to collect data about IOs
- everything with the exception of the Zabbix agent installed on the Docker host is running in a container which is übercool
