Migrating from VMs to Docker containers is quite easy except for the monitoring part. A straightforward approach, running a data collecting agent (such as Zabbix agent), is definitely a not a good solution as it goes against Docker’s philosophy of having one clearly identified task in each container and also because it will require to use custom images. Starting with Gathering LXC and Docker Containers Metrics I came to a simple script based system to gather metrics from Docker containers.
I’m using Zabbix to aggregates the performance metrics so the scripts will be designed to be used in a Zabbix agent user parameter. A user parameter is basically a script run by Zabbix and returning some information. User parameters have to be defined in the agent configuration file but may receive arguments in order to multiple informations from single script.
In spite of being created with Zabbix in mind the rest of this post should be applicable to pretyy much any decent monitoring system.
Host Metrics
These metrics are gathered on the Docker host level rather than the container level. This is more a warm up, a proof of concept or a smoke test to assert that everything is installed correctly in my monitoring system. The goal is to collect several metrics related to the containers:
- the number of running containers
- the total number of defined containers
- the number of crashed containers i.e. how many stopped containers have a non zero exit code.
Below is a straightforward shell implementation:
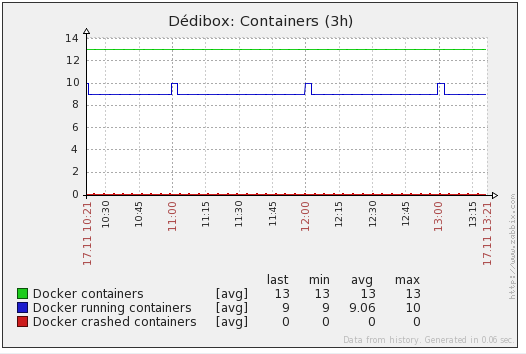
After some Zabbix configuration this leads to a graph looking like this on my box:

Since I have 9 containers running permanently, 3 data containers and one container started by cron every hour this is consistent with my expectations.
A similar script could be written to gather metrics on the images such as the total number of images and how many of them are dangling.
Container Metrics
For a start I wanted to collect for each container the following metrics:
- the container IP address
- the container status (running, paused, stopped, crashed)
- the user and system CPU time
- the memory used by the container processes
- the network activity (in and out)
IP Address and Container Status
Those are found in docker inspect <container-id>. The IP address is found in NetworkSettings.IPAddress and I compute the status from State to get the following values:
- 0 -> Running
- 1 -> Paused
- 2 -> Stopped
- 3 -> Crashed (i.e. stopped with non zero exit code)
CPU and Memory
CPU and memory will be retrieved by peeking under the /sys/fs/cgroup/docker hierarchy in the cpuacct.stat and memory.stat files.
Network activity
According to the blog article, retrieving the network activity is far more complicated than retrieving the CPU or Memory and I was not a big fan of the method mentioned in the article. However those data are quite easy to retrieve from inside the container for instance by running a simple ifconfig eth0 command or by peeking in the /sys hierarchy. Thanks to exec command introduced in Docker 1.3, running a command into a running container can now be done easily without requiring any custom image or any special command when starting the container.
The Script
In order to collect those metrics I created the following python script:
Since I’m using the Docker Python API you should install it before running the script:
pip install docker-py
Conclusion of Part I
Using beginner level python programming we are now able to retrieve some interesting metrics:
- the IP Address
- the container status
- the total CPU time consumed by the container (in seconds)
- the total memory used by the container
- the number of bytes sent or received by the container.
While some datar such as the memory usage or the ip address are directly usable others like the CPU or the network activity will require post processing as we are interested in the changes rather than the total value. This is totally OK and the computation of deltas will be left to the monitoring system (Zabbix).
The worst part of it is the retrieval of the network activity which is a little bit hackish. While I loved the used of the ifconfig command I found out that some images (like the official Mongo image) does not provide the command hence the fallback to the /sys hierarchy. A cleaner solution would be to query the virtual interface from the host but at the moment there is no easy way to retrieve the virtual interface assigned to a container unless I missed something.
Next part: put everything together in Zabbix.
